Don't miss interesting news

An important insight: In 2025, advertising is experiencing a shift from clicks to attention. CTR is an indicator of the attractiveness of an ad, but dwell time shows true engagement. Campaigns that are optimized to increase user attention yield 41% higher brand lift. However, there is no main metric – you need a portfolio of KPIs for specific business goals, so let’s talk about it further.

Metrics are tools for measuring the effectiveness of advertising campaigns that help to evaluate the effectiveness of the money invested. What are metrics in simple terms? This is a numerical indicator that demonstrates a specific aspect of audience interaction with an ad or content.
Marketing metrics fall into several categories:
In the Ukrainian context, advertising is an industry worth $758.22 million in 2025, of which 84.1% will be accounted for by digital channels. Google advertising takes the largest share – $364.21 million, so think about: understanding search metrics is very important.

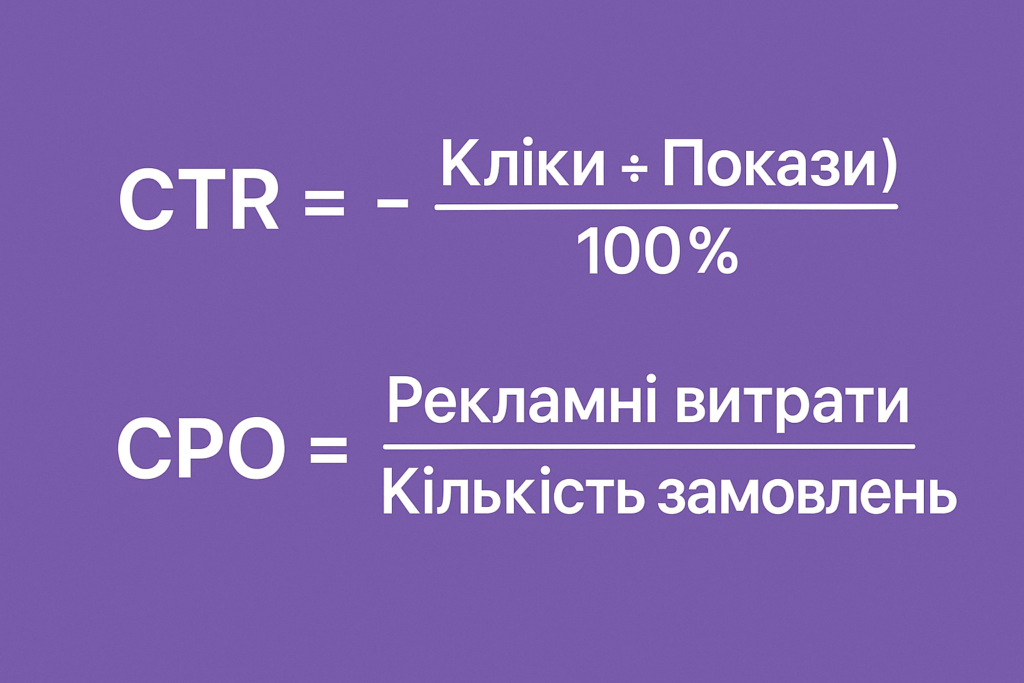
CTR is the percentage of ad impressions that resulted in a click. It’s not hard to understand what CTR is, because CTR is the basic metric of creative appeal on Google Ads, Facebook, Instagram, and other platforms.
The CTR formula looks like this: CTR = (clicks ÷ impressions) × 100%.
The CTR metric in Ukraine shows the following average indicators:
Google ads use CTR to calculate Quality Score, which affects the cost of clicks and positions in the auction. A high CTR reduces CPC and improves ad impressions, especially in competitive niches.
Dwell time is the time of active interaction with content after a click before returning to the SERP or moving on. Unlike the simple “time on page”, this metric takes into account the quality of interaction and user satisfaction.
Targeted advertising in the context of dwell time is especially important:
LinkedIn launched the Average Dwell Time metric in 2024, which showed that: Thought Leader content has a significantly higher engagement time, and professional infographics and tables generate more attention because they are viewed longer.
CPO metric (Cost Per Order) is the cost of attracting one paid order through advertising. CPO = advertising costs ÷ number of orders.
An interesting connection: campaigns with high dwell time often have a lower CPO because high-quality traffic converts better. On the contrary, a high CTR with a low dwell time can lead to an increase in CPO due to low-quality clicks.
For example: an online store spent 50,000 UAH on contextual advertising and received 100 orders. CPO = 500 UAH per order. If the dwell time on the landing page is high, the conversion rate improves and the CPO decreases.
Adelaide’s research on the 2025 media market shows revolutionary results: campaigns optimized for attention metrics show 41% higher top-funnel lift and 55% stronger bottom-funnel effect compared to traditional CTR-oriented approaches.
Longer attention spans are becoming the new currency of digital advertising. Platforms are actively implementing attention metrics in their dashboards:
In Ukraine, advertising is a fast-growing and quite resilient industry. Targeted advertising is the main driver of business growth with a projected share of 87.7% of programmatic revenue by 2030.
Targeted advertising on social media also has its own trends:
Since advertising is not only about clicks or attention separately, an integrated approach is needed:
The dwell time metric is measured via:
CTR tracking is available in:
What is the metric of the future? It is a comprehensive indicator of attention that will unite:
Attention is becoming the “basic minimum” for the effectiveness of advertising investments. Therefore, companies that are the first to adapt attention-first approaches will gain competitive advantages in efficiency and ROI.
There is no main metric in digital advertising – there are only the right metrics to evaluate a specific goal. CTR remains critical for testing attractiveness, but dwell time is becoming key for assessing the quality of interaction and predicting business results.
The future is in user attention, no matter how you slice it: campaigns optimized for attention metrics show significantly better results in top and bottom-funnel performance. The smart approach is to track both metrics, optimizing their fluctuations and “what we expect → experience”, linking them to the final CPO, ROAS, and business KPIs.
Of course, the Ukrainian market should prepare for this shift: platforms are implementing attention metrics, but early adoption of these tools will give competitive advantages in the efficiency and cost of customer acquisition. We believe in you!